
Last Updated: 13th August 2026
UK Food Hygiene Rankings 2026: City & Sector Compliance Index
Which UK cities and hospitality sectors have the best (and worst) food hygiene ratings? We reveal the data, city by city and sector by sector.
Food Hygiene
Article
)
Food hygiene ratings are one of the few pieces of compliance information the public can see at a glance, whether that’s a sticker in a restaurant window or a quick search before booking a table. But how do standards actually compare once you look beyond a single venue and across a whole city, sector, or region?
To find out, we’ve analysed Food Standards Agency (FSA) hygiene rating data across 17 of the UK’s major cities and the business types it covers, from restaurants and takeaways to hospitals, care homes, schools and universities. The results show a clear pattern: some cities are consistently strong performers across almost every type of venue, while others, most notably Birmingham, are falling behind across the board.
Nottingham comes out on top of our index, with an average hygiene rating of 4.84 out of 5 and 89.58% of its food businesses holding the top five-star rating. At the other end of the table, Birmingham has the lowest average of any city we looked at, at just 4.28, with only 64.47% of venues achieving five stars.
Below, we break down what’s driving these differences, city by city and venue by venue, and why a backlog of inspections may be making the problem harder to fix.
Which UK cities have the best and worst food hygiene ratings?
Looking across all food business types, a clear top tier and bottom tier emerge. Nottingham leads the full 17-city index, followed by Brighton and Hove (4.75 average, 83.08% five-star) and Stoke-on-Trent (4.71 average, 80.69% five-star). At the other end of the table, Birmingham finishes last overall, just behind Liverpool (4.33 average) and Manchester (4.47 average), with London not far ahead of them in 15th place, despite being the country’s largest hospitality market.
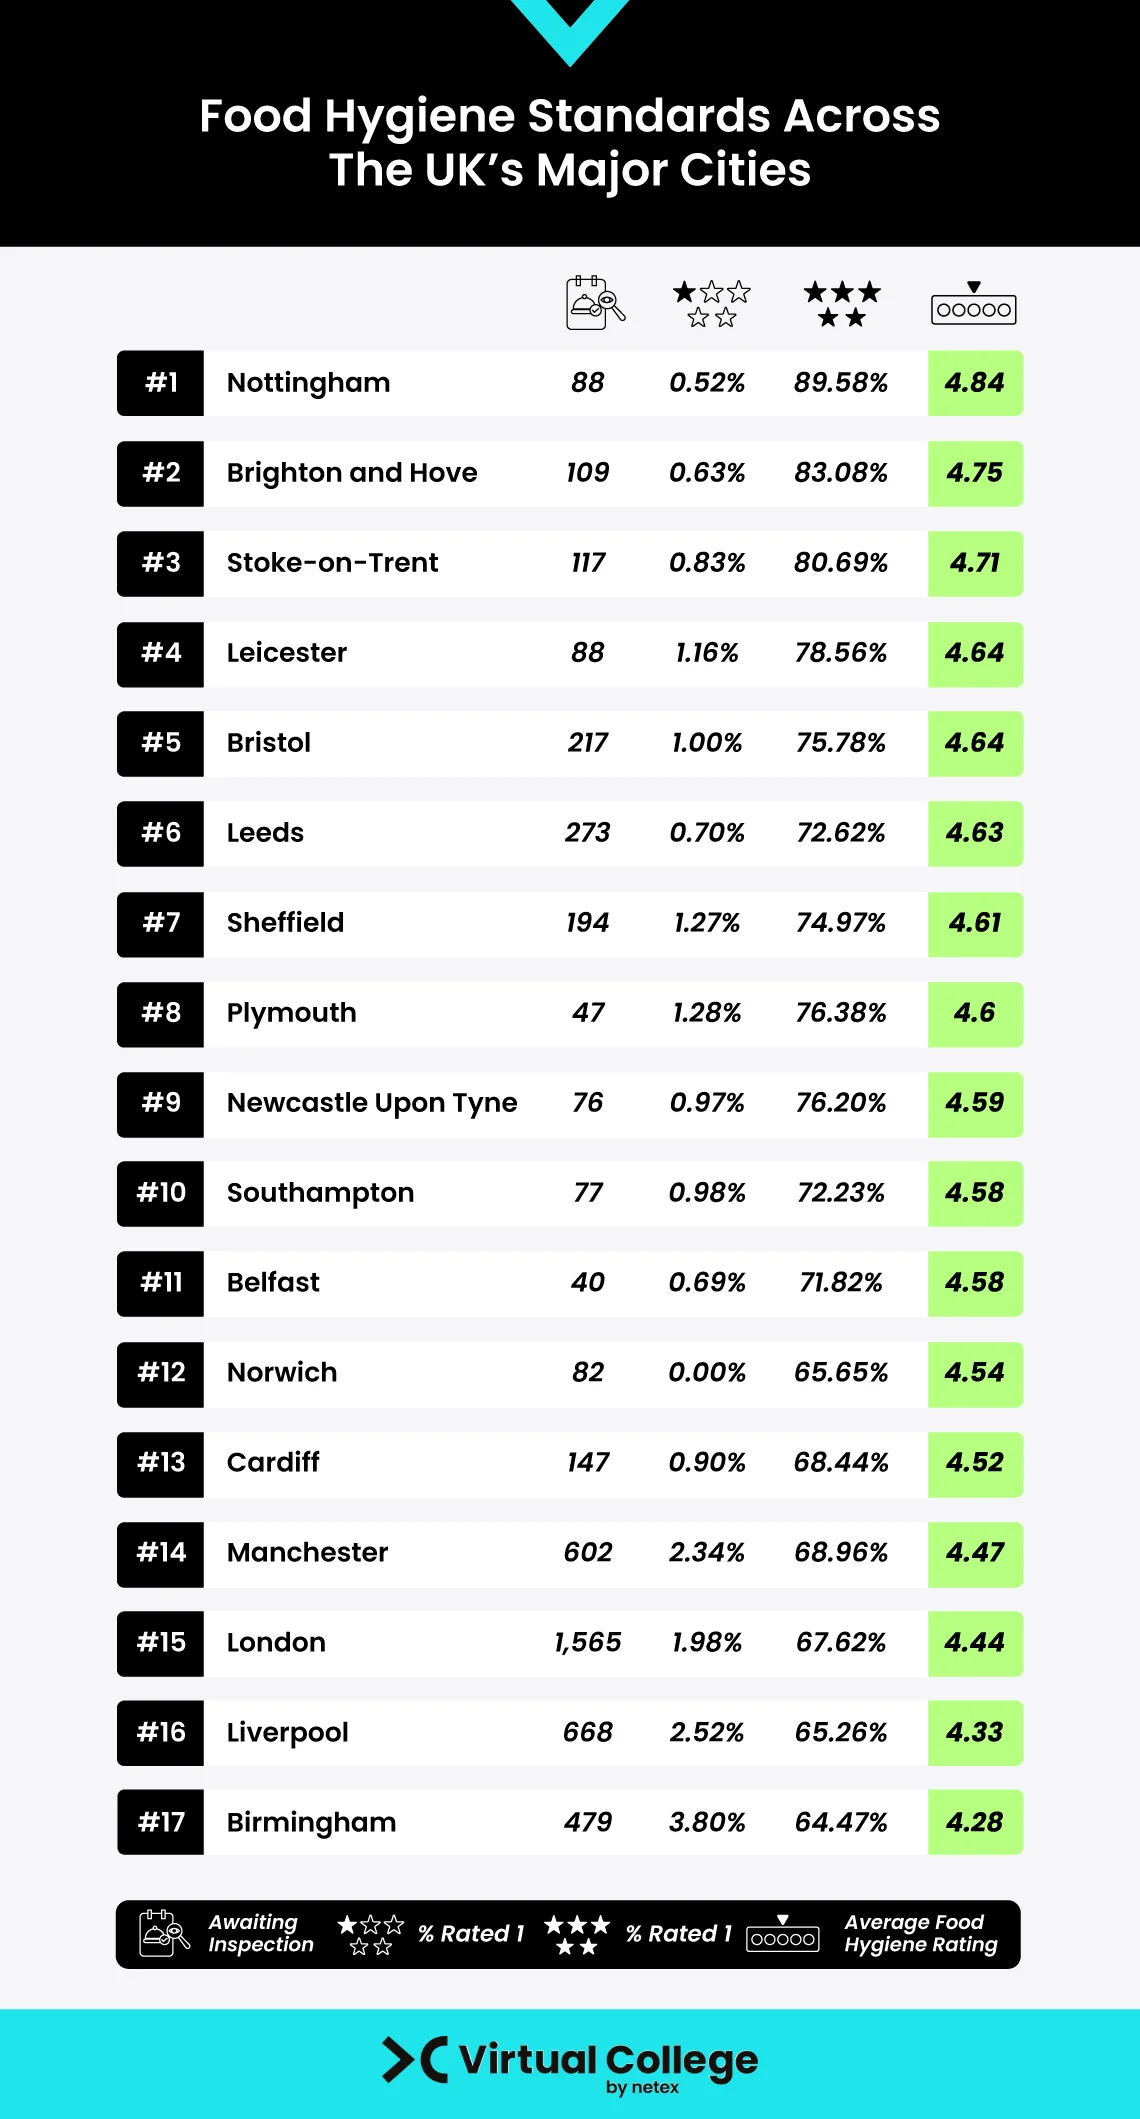
One figure stands out beyond the averages: Birmingham has the highest proportion of one-star ratings of any city in the index, at 3.80%, more than one and a half times the next-highest city, Liverpool (2.52%). By contrast, Norwich recorded no one-star ratings at all, yet still finished 12th overall on a comparatively modest five-star rate of 65.65%, a reminder that a low failure rate doesn’t necessarily mean consistently excellent standards; it can also mean a large cluster of venues sitting in the middle of the scale rather than at either extreme.
How do ratings compare by venue type?
Breaking the picture down by venue type shows Nottingham isn’t just strong on average, it’s the best-performing city in every single category we measured: restaurants and cafés, takeaways, pubs and nightclubs, and schools, universities, hospitals and caring premises.
The worst performer, however, changes depending on the type of venue, which tells its own story:
Restaurants and cafés: Nottingham leads with a 4.9 average; Birmingham is lowest at 4.1.
Takeaways: Nottingham leads with a 4.6 average; Birmingham is lowest at 3.8, the single weakest score recorded anywhere in the index.
Pubs and nightclubs: Nottingham leads with a 4.9 average; Plymouth is lowest, but still a respectable 4.5.
Schools and universities: Nottingham leads with a perfect 5.0 average; Norwich is lowest at 4.8.
Hospitals, childcare and caring premises: Nottingham again leads with a 5.0 average; Liverpool is lowest at 4.7.
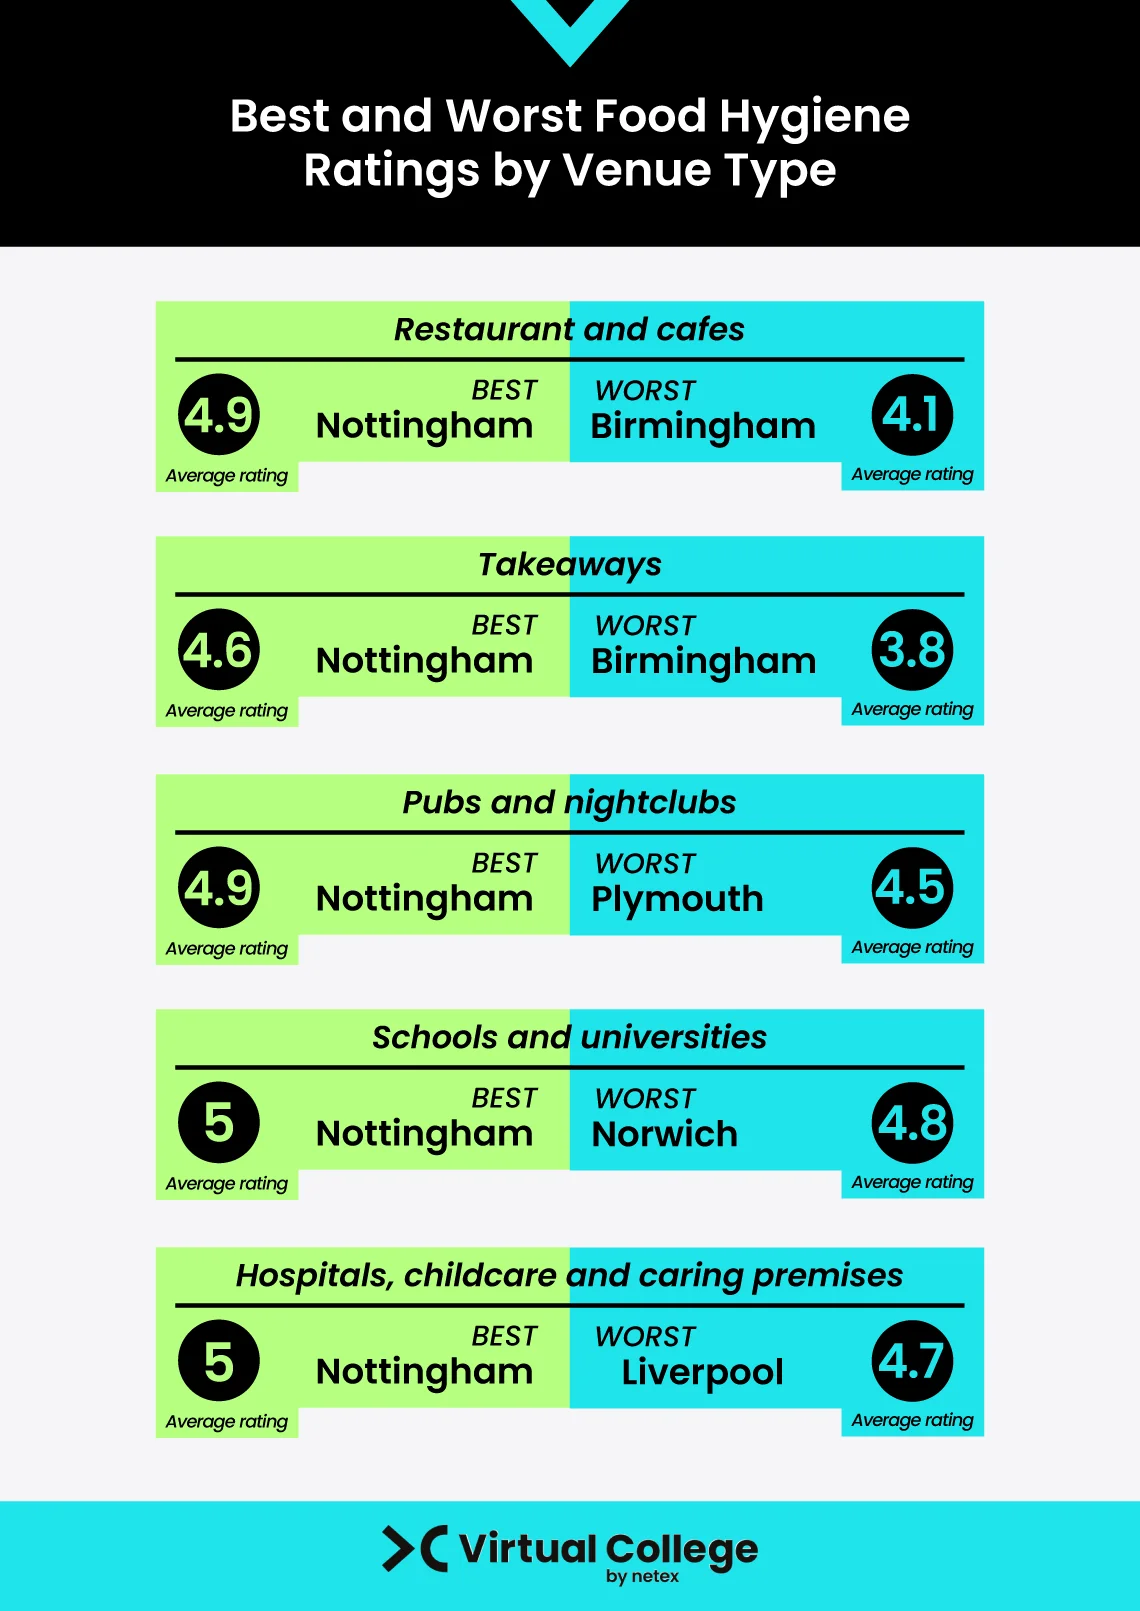
In other words, Birmingham's weakest results are concentrated in food-led hospitality, restaurants, cafés and especially takeaways, while the venues serving the most vulnerable people (schools, hospitals and care settings) still generally score well across the board, even at their weakest points.
For hospitality operators, the pattern in restaurants, cafés, pubs and takeaways points squarely at day-to-day food handling practice. Our Level 2 Food Hygiene course gives food handlers the grounding they need to keep standards consistent, and for teams working front of house too, such as in cafés and coffee shops, our Level 2 Food Hygiene and Barista Training package combines compliance training with practical customer-facing skills.
Hospitals, care homes, schools and universities: a safeguarding concern
Even though schools, universities, hospitals and caring premises score well overall, relative to other venue types, it's still worth paying close attention to this group specifically. These are the settings where the people eating the food, patients, care residents, children and young people, are often among the most vulnerable, and where a lapse in food safety carries a safeguarding dimension as well as a health one.
Liverpool records the lowest average in the hospitals, childcare and caring premises category (4.7), and Norwich the lowest in schools and universities (4.8). Neither figure is dramatic in isolation, but relative underperformance in these settings is worth taking seriously precisely because the people affected are less able to make an informed choice about where they eat, or to raise concerns themselves.
This is where compliance training plays a particularly important role. Anyone preparing or serving food in these settings needs to understand not just general food hygiene principles, but how those principles apply to people who may be more vulnerable to foodborne illness or unable to advocate for themselves. Our Food Hygiene, Nutrition and Hydration in Social Care course is built specifically for staff working in health and social care settings, while teams in schools and other education settings can pair food hygiene training with our safeguarding in education courses to build a fuller picture of their duty of care.
Inspection backlogs: the pressure point behind the ratings
One of the more revealing parts of the data is how many businesses are still awaiting inspection, and where those backlogs are worst.
At a city-wide level, London has by far the largest backlog of any city in the index, with 1,565 businesses awaiting inspection, more than double the next-highest, Liverpool (668). Manchester (602) and Birmingham (479) also carry large backlogs. Notably, these four cities, London, Liverpool, Manchester and Birmingham, also occupy four of the five lowest positions in the overall ratings table, suggesting the backlog isn't purely a function of city size; it's concentrated in some of the same places where hygiene standards are already weakest.
Within that picture, the settings serving vulnerable people show a particular strain. Birmingham has the highest number of hospitals and caring premises waiting for an inspection of any city in our index, with 72 venues yet to be assessed. It also has the second-highest number of schools and universities awaiting inspection, at 29, behind only London, which has 94.
For hospitality and care businesses waiting on an inspection, this is a good reason not to treat the wait as breathing room. Getting food hygiene certification and refresher training in place before an inspector arrives is far preferable to scrambling to catch up once a date is confirmed, and it protects staff, customers, patients and residents in the meantime, regardless of when that inspection happens.
Staying ahead of the standard
Across every part of this index, one thing is consistent: strong hygiene ratings aren't down to luck; they're the result of ongoing training and a genuine culture of food safety, from the kitchen to the front of house. Whether you manage a restaurant, run a care home kitchen, or oversee catering in a school, keeping your team's food hygiene certificate up to date is one of the most effective ways to stay ahead of the standard, rather than catching up to it.
Explore our full range of food hygiene courses, including our popular Level 2 Food Hygiene course, to make sure your business and your team are ready, whenever the next inspection comes.
Methodology
Data was collected using Food Standards Agency hygiene rating data for 2026, grouped by city and business type, across 17 of the UK's major cities. We identified the highest and lowest average hygiene ratings overall and for each food-handling venue type (restaurants and cafés, takeaways, pubs and nightclubs, schools and universities, and hospitals, childcare and caring premises). We also identified the number of businesses awaiting inspection by city and business type, along with the percentage of five-star and one-star ratings recorded in each area.
Source: Food Standards Agency